IGNOU Solved assignment

BECC- 108 INTERMEDIATE MICROECONOMICS - II
Q 1. (a) Explain the features of a monopoly market structure. What are the characteristics of a natural monopoly?
Ans-
Monopoly Market Structure
A monopoly is a market structure where a single seller controls the supply of a particular good or service. This lack of competition gives the monopoly significant power to influence market prices and output. Here are the key features of a monopoly market structure:
- Single Seller: One firm dominates the market, eliminating competition from other producers.
- Price Setter: The monopoly has significant control over the price of the good or service it offers. This is because there are no close substitutes readily available to buyers.
- Barriers to Entry: High barriers to entry prevent potential competitors from entering the market and challenging the monopoly's dominance. These barriers can include:
- Economies of Scale: The production process may be most efficient at a large scale, making it difficult for new entrants to compete on cost.
- Government Regulations: Licenses, patents, or exclusive rights granted by the government can restrict competition.
- High Startup Costs: The initial investment required to enter the market may be prohibitive for new firms.
- Ownership of Essential Resources: The monopoly may control a crucial resource necessary for production, making it difficult for others to compete.
- Limited Output: Monopolies often produce less than the output level that would maximize social welfare (total benefit for both consumers and producers) in order to maintain higher prices and profits.
- Reduced Innovation: Lack of competition may stifle innovation as the monopoly has little incentive to improve products or processes due to the absence of competitive pressure.
Characteristics of a Natural Monopoly
A natural monopoly arises when a single firm can provide a good or service to an entire market at a lower cost than if there were multiple competing firms. This typically occurs due to the presence of significant economies of scale:
- High Fixed Costs: The initial investment required to set up the infrastructure for production is very high. Spreading these costs over a larger output (serving the entire market) leads to lower average costs per unit. Examples include electricity grids, water distribution systems, or telecommunication networks.
- Network Effects: The value of the good or service increases as more people use it. For instance, a phone network becomes more valuable with each additional user. Duplicating such networks would be inefficient and lead to wasted resources.
Q1. (b) How does a monopolist decide its profit maximising output? Explain with the help of appropriate diagram.
Ans- A monopolist, unlike firms in a perfectly competitive market, can influence the price of their good or service due to the lack of competition. To maximize profits, a monopolist considers the relationship between production costs and the revenue generated at different output levels. Here's how they determine the profit-maximizing output:
1. Marginal Revenue vs. Marginal Cost:
- Marginal Revenue (MR): The additional revenue earned from selling one more unit of output. Unlike a perfect competitor who faces a constant price, a monopolist's price and therefore revenue change as they sell more units (demand curve slopes downward). This means the additional revenue from each extra unit sold (MR) will also decline.
- Marginal Cost (MC): The additional cost incurred to produce one more unit of output. This typically increases as production rises due to factors like diminishing marginal returns or the need to utilize less efficient resources at higher production levels.
2. The Profit-Maximizing Point:
The monopolist achieves maximum profit by producing the output level where marginal revenue (MR) equals marginal cost (MC). This is the point where the additional revenue from one more unit sold (MR) is exactly offset by the additional cost of producing that unit (MC).
Here's a diagram illustrating this concept:
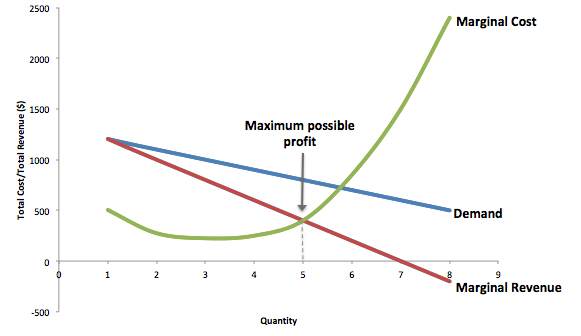
Explanation of the Diagram:
- The demand curve (D) shows the relationship between price (P) and quantity demanded (Q). As the price goes down, the quantity demanded increases (downward slope).
- The marginal revenue (MR) curve typically slopes downward faster than the demand curve because the additional revenue from each extra unit sold keeps decreasing.
- The marginal cost (MC) curve initially increases gradually but may become steeper at higher output levels due to diminishing returns.
- The profit is maximized at the output level (Q*) where the MR curve intersects the MC curve. At this point, the difference between the price (P*) and the marginal cost (MC*) is the maximum profit per unit the monopoly can achieve.
Q 2. (a) Consider a duopoly of firm 1 and 2 producing a homogenous product, the demand of which is described by the following demand function: Q = 1/2(100 – P) Where Q is total production of both firms (i.e., Q = Q1 +Q2) marginal cost of production faced by both firms be Rs. 40, i.e.MC1 = MC2 = 20. Calculate the residual demand function for both the firms. Using them ascertain their reaction curves and the Cournot-Nash equilibrium quantity produced by each firm?
Ans-
Solving the Cournot Duopoly Model
We can solve this problem step-by-step to find the Cournot-Nash equilibrium for the duopoly:
1. Market Demand Function:
The given demand function represents the total market demand (Q) for the homogenous good produced by both firms:
- Q = 1/2 (100 - P)
2. Individual Firm's Demand (Residual Demand):
Since we have a duopoly, each firm needs to consider the other firm's production (Q2 for firm 1 and Q1 for firm 2) when determining its own output (Q1 or Q2). To find the residual demand function for each firm, we can use the concept of market share.
Here's the approach:
-
Assume firm 1 produces Q1 units and firm 2 produces Q2 units.
-
The total market quantity (Q) becomes Q = Q1 + Q2.
-
Substitute this combined quantity (Q1 + Q2) back into the market demand function:
Q = 1/2 (100 - P) Q1 + Q2 = 1/2 (100 - P)
-
Now, suppose firm 1 wants to find the price (P) it will receive based on its own production level (Q1) assuming firm 2 produces a fixed quantity (Q2). This is essentially firm 1's residual demand function.
-
Rearrange the equation to isolate the price (P) that depends on Q1 and the fixed Q2:
P = 100 - 2(Q1 + Q2)
3. Firm-Specific Residual Demand Functions:
-
Firm 1's Residual Demand: P = 100 - 2(Q1 + Q2) (Here, Q2 is treated as a constant for firm 1)
-
Firm 2's Residual Demand: P = 100 - 2(Q1 + Q2) (Here, Q1 is treated as a constant for firm 2)
4. Reaction Curves:
A reaction curve shows the optimal output level (Q) a firm chooses for a given level of output by its competitor.
- Each firm will assume the other firm's output (Q2 for firm 1 and Q1 for firm 2) is fixed and then maximize its own profit based on its residual demand function.
- Finding the reaction curve mathematically requires maximizing the profit function for each firm, which involves considering their marginal revenue and marginal cost. However, a graphical approach can also be used to depict the reaction curves.
5. Cournot-Nash Equilibrium:
The Cournot-Nash equilibrium is the point where the reaction curves of both firms intersect. At this point, each firm is producing the optimal output level given their expectation of the other firm's output, and neither firm has an incentive to change its production level.
Q.2 (b) Discuss the dominant strategy and dominated strategy in a game through an example. Is Nash equilibrium always indicated dominant strategy? Why or why not? Explain.
Ans-
Dominant and Dominated Strategies with Game Examples
Dominant Strategy:
A dominant strategy in a game theory scenario is an action choice for a player that is always better than any other option, regardless of what the other player(s) do. In simpler terms, it's the best move a player can make, no matter what the opponent chooses.
Dominated Strategy:
A dominated strategy, on the other hand, is an action choice for a player that is always worse than at least one other option, regardless of what the other player(s) do. It's a strategy a rational player would never choose because there's always a better alternative.
Example: The Prisoner's Dilemma:
Consider the classic Prisoner's Dilemma game:
Two criminals, Alice and Bob, are arrested and can choose to cooperate (C) with the police or defect (D). The payoff matrix shows the potential jail sentences (in years):
| Cooperate (C) | Defect (D) | |
|---|---|---|
| Alice Cooperates (C) | (2, 2) | (0, 4) |
| Alice Defects (D) | (4, 0) | (3, 3) |
Here's the analysis:
- For Alice: Defecting (D) is a dominant strategy. Regardless of what Bob does, Alice gets a shorter sentence by defecting (0 or 3 years) compared to cooperating (2 or 4 years).
- For Bob: The situation is similar. Defecting (D) is a dominant strategy for Bob as well.
Even though defecting is the dominant strategy for both players, it leads to a worse outcome for both (3 years each) compared to if they had cooperated (2 years each). This highlights the potential drawbacks of always following dominant strategies.
Nash Equilibrium vs. Dominant Strategy:
A Nash equilibrium is a combination of strategies where no player has an incentive to deviate from their chosen action given the actions of the other players. It's a stable outcome where everyone is "doing the best they can" based on their understanding of the game.
However, a Nash equilibrium is not always achieved through dominant strategies. In the Prisoner's Dilemma, defecting is the Nash equilibrium, but it's not a dominant strategy for either player because they would both benefit from cooperating if the other did the same.
Here's a summary:
- A dominant strategy guarantees a good outcome for a player regardless of the opponent's choice.
- A Nash equilibrium is a stable outcome, but it may not always be the best outcome for every player.
Q. 3. Consider a monopolist facing an inverse demand function P(Q) = 10 – Q, and total cost function 2Q + Q 2 . Calculate the deadweight loss associated with this market condition.
Ans-
Monopoly and Deadweight Loss Calculation
We can calculate the deadweight loss associated with this monopoly using the following steps:
-
Find the Monopoly Equilibrium Output (Qm) and Price (Pm):
-
A monopolist maximizes profit by setting marginal revenue (MR) equal to marginal cost (MC).
-
Marginal Revenue (MR): The derivative of the inverse demand function (P(Q)) with respect to quantity (Q). In this case, MR = -1 (since the demand function is linear, the derivative is a constant).
-
Marginal Cost (MC): The derivative of the total cost function (C(Q)) with respect to quantity (Q). Here, MC = 2 + 2Q.
Setting MR = MC and solving for Qm:
-1 = 2 + 2Qm Qm = -1.5 (Since marginal revenue is always negative in this case, a negative quantity for Qm doesn't have a real-world economic meaning. We can interpret this as Qm = 0, indicating the monopolist might choose not to produce at all, resulting in a zero output situation)
- Since we cannot have a negative output, let's assume the monopolist produces a positive output. We will find the price (Pm) at a positive output level (Q) where MR = MC.
Assuming a positive output level (let's say Q = 1), we can calculate the corresponding MC:
MC = 2 + 2(1) = 4
Since MR = -1, for the monopolist to be operating in the positive output range (where MR = MC), we need to adjust the demand function slightly to avoid the negative quantity issue. A common adjustment for linear demand is to add a constant value to both sides that ensures a positive quantity for a zero price. Let's add 11 to both sides of the original demand function:
P(Q) = 10 - Q + 11 (adjusted demand function)
The new adjusted demand function is P(Q) = 11 - Q. Here, when Q = 1, the price (Pm) is:
Pm = 11 - 1 = 10
-
-
Find the Price (Pc) and Quantity (Qc) under Perfect Competition:
-
In perfect competition, firms face a horizontal demand curve at the market price, which is equal to marginal cost (MC) for the firm in the long run.
-
Since we already have the marginal cost function (MC = 2 + 2Q), we can set it equal to the market price (Pc) to find the equilibrium quantity (Qc) under perfect competition.
Pc = MC = 2 + 2Qc Qc = 4 (assuming positive marginal cost)
-
-
Calculate the Deadweight Loss:
Deadweight loss (DWL) is the loss of economic efficiency due to the monopoly power. It's represented by the triangular area between the demand curve, the monopoly price (Pm), and the price that would prevail under perfect competition (Pc).
- Area of the triangle DWL = 1/2 * base * height
- Base = difference in quantities between monopoly (Qm) and perfect competition (Qc) = Qc - Qm (assuming positive output for the monopolist)
- Height = difference in prices between monopoly (Pm) and perfect competition (Pc) = Pm - Pc
In this scenario (assuming positive output for the monopolist):
DWL = 1/2 * (Qc - Qm) * (Pm - Pc)
Since we cannot have a negative output level for the monopolist (Qm = 0), the deadweight loss cannot be directly calculated using this formula.
- Area of the triangle DWL = 1/2 * base * height
Q. 4. What do you understand by the term ‘adverse selection’? Discuss with the reference to market for lemons.
Ans- Adverse selection is a situation in markets with asymmetric information, where the party with less information (usually the buyer) ends up in a worse position because the party with more information (usually the seller) has an incentive to withhold information or participate in the market selectively.
Understanding Adverse Selection with the Market for Lemons:
The concept of adverse selection is most famously explained through the example of the used car market, often referred to as the "market for lemons." Here's how it works:
- Information Asymmetry: Buyers of used cars typically have less information about the car's true condition compared to the sellers (previous owners). The seller knows if the car is a reliable one (a "peach") or a problematic one (a "lemon").
- Selection Bias: Due to the information asymmetry, sellers of lemons (low-quality cars) are more likely to be willing to sell their cars compared to sellers of peaches (high-quality cars). This is because the seller of a lemon knows they won't get a good price if they try to sell it to someone who knows its true condition. On the other hand, sellers of peaches may be hesitant to sell a good car at a potentially undervalued price in a market saturated with lemons.
- Market Distortion: As more lemons enter the market, the average quality of used cars offered for sale goes down. This discourages potential buyers from entering the market, further reducing demand for even the good quality cars (peaches). This downward spiral can eventually lead to a market collapse where only lemons are left, making it nearly impossible for buyers to find a good quality used car.
Q. 5. Explain the concept of contract curve by showing efficiency in production. How is pareto optimality related to the contract curve? Discuss.
Ans-
Contract Curve and Pareto Optimality in Production
The concept of the contract curve is closely linked to Pareto optimality, both playing crucial roles in understanding efficient resource allocation in production. Here's a breakdown of each concept and their relationship:
1. Contract Curve:
The contract curve, also known as the Pareto set in production possibility frontier (PPF) analysis, represents the set of all efficient allocation points achievable through mutually beneficial trading between two producers. It defines the range of production possibilities where both producers can be better off (or at least as well off) compared to their initial resource endowments.
Visualizing the Contract Curve:
Imagine a scenario with two producers, A and B, who can produce two goods, X and Y, using their limited resources. The PPF for each producer shows their possible production combinations for X and Y given their individual resource constraints.
- The combined PPF for both producers is created by overlaying their individual PPF curves.
- The contract curve lies within the combined PPF, but it may touch the boundaries at certain points.
- Points on the contract curve represent allocations where producers can trade with each other to achieve a higher level of satisfaction for both compared to their initial production levels.
Efficiency and the Contract Curve:
- Points on the contract curve are considered Pareto efficient. This means it's impossible to improve the production level of one good (X) for either producer without decreasing the production level of the other good (Y) for the other producer, and vice versa. In simpler terms, all resources are being used in the most efficient way possible, given the available technology and resource constraints.
- Points inside the contract curve are considered inefficient. This means producers could potentially reallocate resources or trade with each other to achieve a higher output level for at least one good without sacrificing the production of the other good.
- Points outside the combined PPF are unattainable given the producers' resource constraints.
2. Pareto Optimality:
Pareto optimality, named after Italian economist Vilfredo Pareto, is a concept in economics that describes a situation where no individual can be made better off without making someone else worse off. It represents an efficient allocation of resources where everyone involved is getting the most benefit they can from the available resources.
Relationship Between Contract Curve and Pareto Optimality:
- The contract curve is a subset of all Pareto-optimal allocations in production possibility frontier analysis.
- All points on the contract curve are Pareto optimal, but not all Pareto-optimal allocations may be achievable through voluntary trading between producers. This can happen due to factors like:
- Transaction Costs: The costs associated with negotiating and enforcing contracts may prevent mutually beneficial trades from occurring, even if they are Pareto optimal.
- Incomplete Information: Producers may not have complete information about each other's production capabilities or preferences, hindering their ability to identify and reach mutually beneficial trading opportunities.
Q. 6. Bring out the difference between the general equilibrium analysis and partial equilibrium analysis.
Ans- General equilibrium analysis and partial equilibrium analysis are two approaches used in economics to understand how markets function. Here's a breakdown of their key differences:
Scope of Analysis:
- General Equilibrium: Analyzes the entire economy as a complex system of interconnected markets. It considers how changes in one market can ripple through and affect other markets simultaneously.
- Partial Equilibrium: Focuses on a single market or a small group of related markets, isolating them from the broader economic system. It assumes that changes in other markets have minimal or no impact on the market being studied.
Assumptions:
- General Equilibrium: Makes more complex assumptions, acknowledging the interconnectedness of markets. It assumes factors like prices, wages, and resource allocation are determined by the interaction of supply and demand across all markets.
- Partial Equilibrium: Makes simpler assumptions, often treating prices of other goods (except close substitutes or complements) and resource availability as fixed. This allows for a more focused analysis of a specific market.
Strengths and Weaknesses:
- General Equilibrium:
- Strengths: Provides a more holistic view of the economy and can capture complex interactions between markets.
- Weaknesses: Can be mathematically complex and computationally challenging. May not be as suitable for analyzing specific market dynamics.
- Partial Equilibrium:
- Strengths: Easier to implement and understand, allowing for a more in-depth analysis of a specific market.
- Weaknesses: May overlook important interactions with other markets, potentially leading to inaccurate conclusions.
Applications:
- General Equilibrium: Used to analyze the effects of broad economic policies like changes in interest rates, government spending, or taxation on the entire economy.
- Partial Equilibrium: Used to analyze the effects of specific events or policies on a particular market, such as the impact of a tariff on a specific imported good or a minimum wage increase on a particular industry.
Q. 7. What are the inefficiencies related to a positive externality? Explain with the help of a diagram.
Ans-
Positive Externalities and Inefficiencies
A positive externality arises when the production or consumption of a good or service by one party generates an uncompensated benefit for a third party. This creates an inefficiency in the market because the market price doesn't fully reflect the true social cost or benefit of the good or service.
Inefficiency due to Underproduction:
In the case of a positive externality, the market tends to underproduce the good or service that generates the positive externality. Here's why:
- Private vs. Social Benefits: Producers only consider their own private costs and the revenue they receive when making production decisions. They don't take into account the positive externalities they create for others.
- Market Price Doesn't Reflect Full Benefit: Since the positive externality isn't captured in the market price, the price only reflects the private benefits to the consumers who directly purchase the good or service. This leads to an underestimation of the good's true value to society.
Diagrammatic Explanation:
Imagine a market for vaccinations. When someone gets vaccinated, they not only protect themselves from a disease but also help to reduce the spread of the disease in the community (positive externality).

- Demand Curve (D): Represents the willingness of individuals to pay for vaccinations based on the direct benefit of being protected from the disease (private benefit).
- Social Marginal Benefit (SMB): Represents the total benefit to society from vaccinations, including both the private benefit to the vaccinated individual and the positive externality of reduced disease transmission in the community.
- Marginal Cost (MC): Represents the cost of producing and administering a vaccine.
- Equilibrium Price (Pe) and Quantity (Qe): At the market equilibrium, price (Pe) is determined by the intersection of the demand curve (D) and the marginal cost curve (MC). This results in quantity (Qe) being produced and consumed.
Q. 8. Explain the concept of price discrimination with reference to first degree price discrimination.
Ans-
Price Discrimination and First-Degree Pricing
Price discrimination is a marketing strategy where a firm charges different prices for the same good or service to different customer groups. This allows the firm to capture more consumer surplus and increase profits. There are three main degrees of price discrimination:
- First-Degree Price Discrimination (Perfect Price Discrimination): This is the most extreme form of price discrimination where the firm charges each customer the maximum price they are willing to pay for a unit of the good or service.
Key Features of First-Degree Price Discrimination:
- Requires Perfect Information: The firm needs to know the exact reservation price (the maximum price a customer is willing to pay) for each individual customer. This is often difficult or impossible to achieve in real-world scenarios.
- Customization: The price is tailored to each customer based on their willingness to pay.
- Potential for Efficiency: By charging the maximum price each customer is willing to pay, the firm can potentially extract all of the consumer surplus, leading to a situation closer to perfect efficiency (compared to other pricing strategies).
Q. 9. Distinguish between the classical utilitarian social welfare function and the minimax social welfare function.
Ans-
Classical Utilitarian Social Welfare Function (Benthamite):
- Focus: This function prioritizes maximizing the total utility of all individuals in society.
- Underlying Principle: It follows the principle of utilitarianism, stating that the best social outcome is the one that generates the greatest happiness or well-being for the greatest number of people.
- Calculation: It sums up the individual utilities of all members of society.
Mathematically:
W = Σ Ui (i = 1 to n)
- W represents social welfare.
- Ui represents the utility of individual i.
- Σ represents the sum across all individuals (n) in society.
Minimax Social Welfare Function (Rawlsian):
- Focus: This function prioritizes the welfare of the worst-off individual in society.
- Underlying Principle: It follows the principle of justice as fairness, as proposed by John Rawls. This principle suggests that a just society should maximize the minimum level of well-being for all its members.
- Calculation: It focuses on the minimum level of utility achieved by any individual in society.
Mathematically:
W = min(U1, U2, ..., Un)
- W represents social welfare.
- Ui represents the utility of individual i.
- min represents the minimum value among the utilities of all individuals (n) in society.
Q. 10. Differentiate between a sequential game and a simultaneous game with the help of examples.
Ans-
The key difference between sequential games and simultaneous games lies in the timing of player decisions.
Sequential Game:
- Players move one after another in a predetermined order.
- A player can make decisions based on the actions they observe from previous players.
- This allows for strategic thinking and potential for bluffing or outmaneuvering opponents based on their past actions.
Example: Chess:
- In chess, players take turns moving their pieces on the board.
- Each player can observe the opponent's move before making their own, allowing them to formulate a strategy based on the developing situation.
- Decisions can be based on attacking, defending, or setting traps based on the opponent's previous moves.
Simultaneous Game:
- Players make their choices at the same time, without knowledge of what the other players are choosing.
- Decisions rely on anticipating the opponent's potential actions, but not observing them directly.
Example: Rock-Paper-Scissors:
- In rock-paper-scissors, both players throw their hand signs simultaneously.
- Each player chooses their action based on their own strategy (e.g., playing randomly, trying to counter the opponent's last move, etc.) without knowing what the other player will do.
0 Comments